

Author’s note: How long a Codex task takes is determined by the model, reasoning effort, service path, tool loop, cache, and network. Running the same task as a control and timing each segment is how you find the bottleneck.
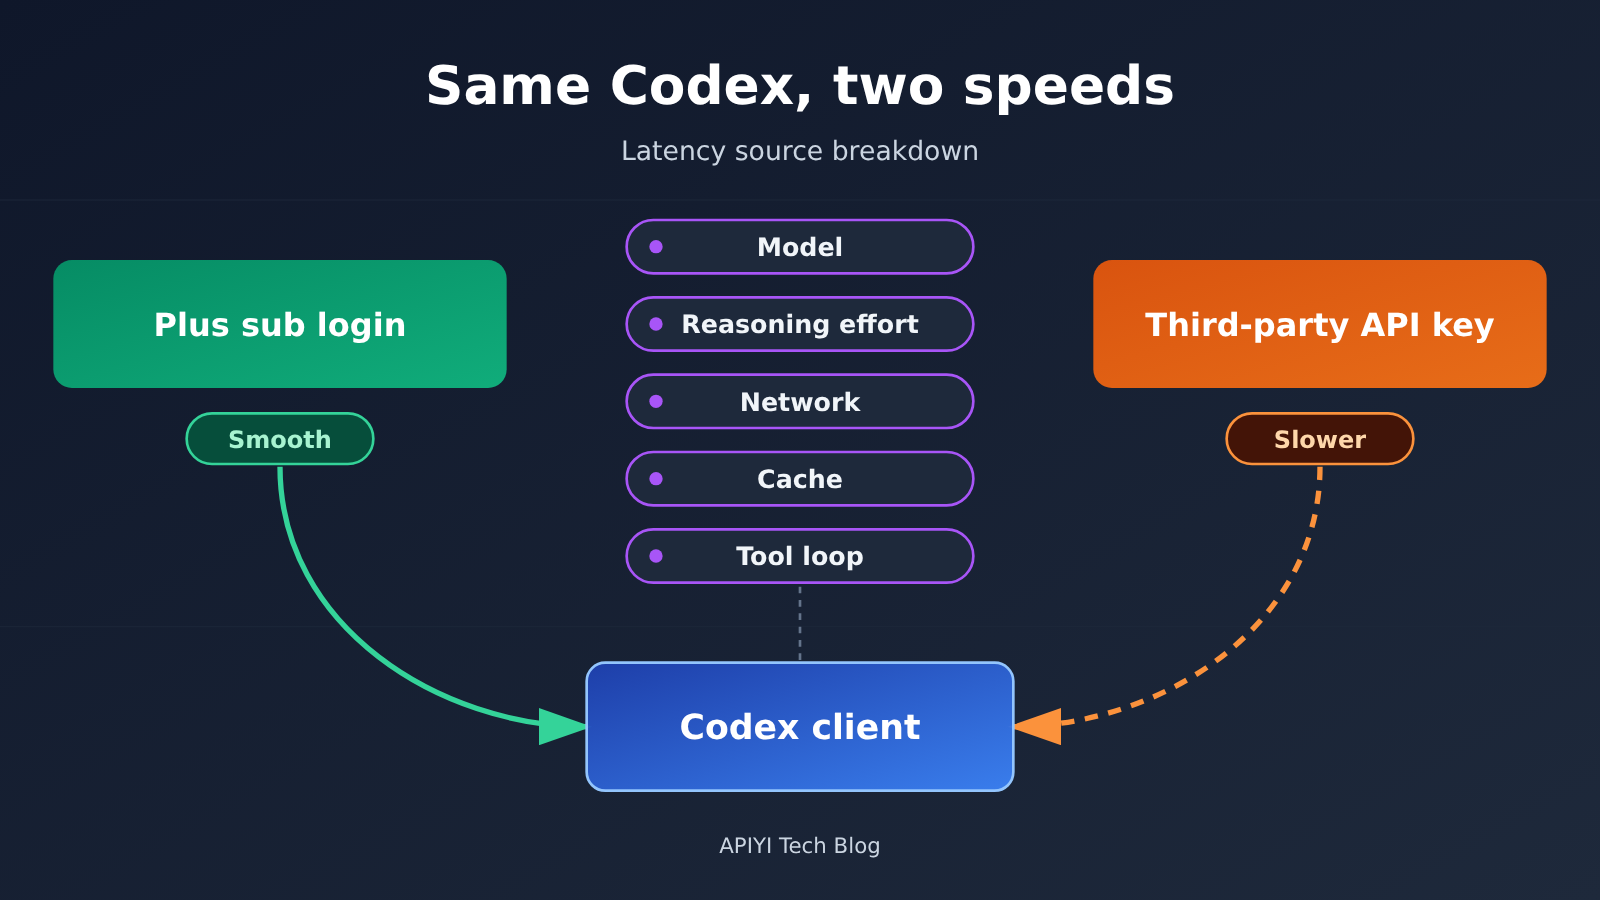
The same Codex feels smooth when you sign in with ChatGPT Plus, but slows down once you switch to a third-party API key. The usual reason is that the two take different service paths, and Codex’s agent loop multiplies the extra latency in each round of requests. The client UI is identical, but the model deployment, reasoning tier, transport protocol, cache hit rate, and level of tool-event compatibility can all differ. An extra 3 seconds per request can add up to about 1 minute on a coding task that needs 20 serial calls.
Below, I’ll first break down how Codex works and the two integration paths, then walk through each source of latency on the third-party API, using two public GitHub issues as case evidence. After that comes four core metrics, three sets of control tests, and optimization plans organized by symptom, so you can tell whether your Codex is slow in the model, the network, the cache, or the tool loop. Finally, I’ll discuss which metrics reflect true cost better than unit price when you’re choosing a third-party API.
To Know: Terms for Understanding Codex Speed Differences
| Term | Explanation |
|---|---|
| Codex Harness | Codex’s execution framework, which organizes the model, tools, context, and the multi-turn task loop. |
| Responses API | An interface provided by OpenAI that supports model output, tool calling, and multi-turn state management — Codex relies on it to run. |
| TTFT | Time To First Token, the wait time from sending a request to receiving the first output token. |
| TPS | Tokens Per Second, the number of tokens generated per second, reflecting sustained output speed. |
| End-to-end duration | The total time from submitting a task to its final completion, including all model invocations and tool executions. |
| Reasoning effort | The depth level of the model’s thinking, such as low, medium, or high; higher levels usually mean more output and longer durations. |
| Tool Calling | The process where the model asks external programs to read files, run commands, and so on, then continues reasoning with the results. |
| Prompt Caching | When the input prefix repeats and meets the conditions, existing computation results are reused to cut down processing time. |
| SSE | Server-Sent Events, where the server continuously pushes events over a one-way HTTP connection. |
| WebSocket | A persistent two-way connection that multiple rounds of requests can reuse. |
| previous_response_id | A parameter in the Responses API that references the previous round’s response; combined with incremental input, it reduces redundant transmission. |
| Service tier | Different processing options for the same model, such as Standard or Fast, each with its own speed and price. |
1 Why Can the Same Codex Have Two Different Speeds?
1.1 Codex Subscription Sign-In and API Key Take Different Service Paths
According to OpenAI’s authentication docs, Codex CLI, IDE extensions, and desktop apps all support two sign-in methods: signing in with a ChatGPT account, or entering an API key. ChatGPT sign-in draws on the Codex usage entitlement included with the subscription and its corresponding limits. An API key follows the metered billing and rate-limit rules of the API account. A Plus subscription by itself doesn’t include free access to any OpenAI API.
When you connect a third-party API key, the Codex client only organizes the task; the actual inference happens on the service behind that endpoint. The model actually invoked, the billing method, the streaming protocol, and the service quality are all determined by the third-party endpoint and its backend implementation. So if the model name shown in the client is the same, that only means you picked the same name. It doesn’t confirm that both requests went through the same model deployment, service queue, and transport path.
1.2 Codex’s Agent Loop Means It Has to Call the Model Repeatedly
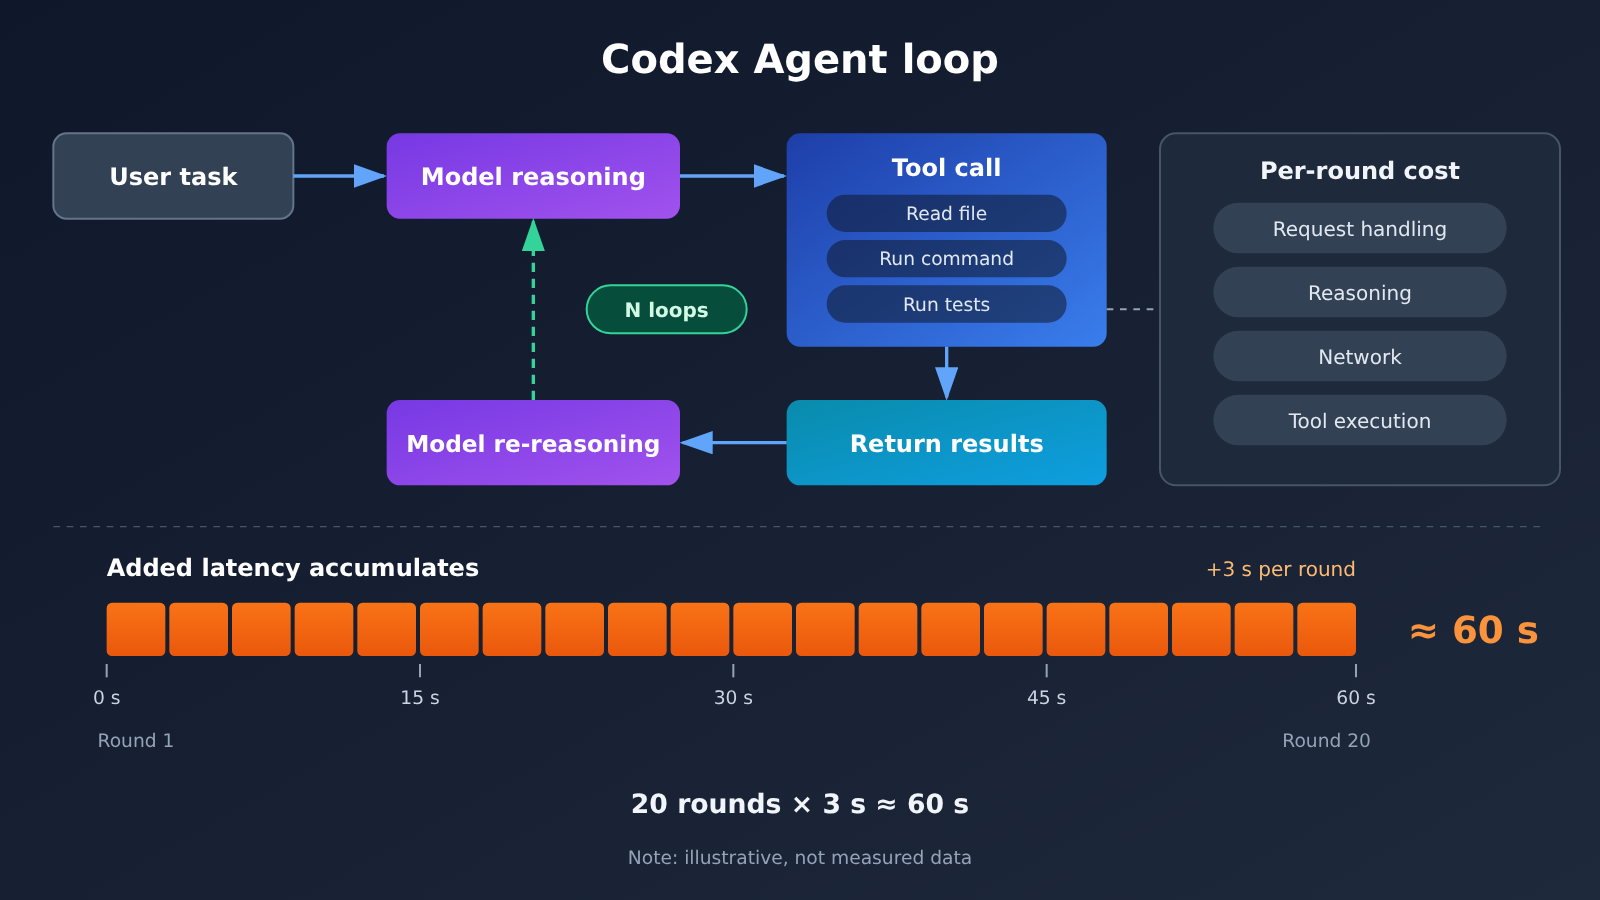
In its August 19, 2026 post, “Codex as a platform,” OpenAI explains that Codex’s open-source Agent Harness is responsible for understanding tasks, maintaining context, searching the codebase, invoking the shell, editing files, running tests, and handling failure recovery, user approval, and execution boundaries. At its core, it’s a loop: model inference → tool execution → inference again.
In an engineering post from April 22, 2026, OpenAI described a typical flow: the user asks for a change, the model figures out what needs to be done, Codex reads files or runs commands, and after the tool returns its result, the model re-analyzes it. It then continues calling tools, editing code, running tests, and checking results. A complex task can involve dozens of back-and-forth rounds between the model and tools, and each round is a complete API request.
Where Do the Speed Differences in Codex with Third-Party APIs Come From?
Here’s a table summarizing the five main sources of latency, followed by a detailed breakdown.
| Latency Source | Mainly Affected Metrics | Typical Symptoms | Investigation Priority |
|---|---|---|---|
| Model and reasoning effort | TPS, per-turn inference time | Output stays consistently slow, long thinking time | High |
| Service tier and routing | TTFT, fluctuation magnitude | Slow first response or erratic speed | High |
| Gateway and network path | Fixed added time per turn | A steady extra few seconds with every call | Medium |
| Transport protocol (SSE / WebSocket) | Cumulative overhead across turns, connection stability | Slow on long tasks, stream drops midway | Medium |
| Caching and tool loops | Input processing time, number of call rounds | Noticeably slower on long conversations, too many rounds | High |
2.1 How Model Inference Speed and Reasoning Effort Affect Codex Runtime
Before comparing the two access methods, you must first confirm whether the actual model ID, reasoning effort, model version, and service tier are consistent. Reasoning effort ranges from low to xhigh and max — the higher the tier, the more thinking content the model generates, and the longer each turn takes.
OpenAI’s latency optimization guide lists output token count as a key variable affecting inference time: in some scenarios, cutting output tokens by about 50% can reduce generation latency by nearly 50% as well, while reducing ordinary input text usually has a much smaller impact. The service tier matters too — OpenAI’s Fast mode can be up to 2.5x faster for applicable models and loads, but it’s a paid tier option and only applies to certain models.
This means that even if both the subscription side and the third-party side show the same model, any difference in reasoning tier or service tier will produce an obvious speed gap.
2.2 How API Proxying, Network Paths, and WebSocket Affect Multi-Turn Tasks
Third-party APIs often involve a longer request chain: client → provider gateway → proxy node → potentially a cross-border link → the final inference service. Each extra hop can add a bit of fixed latency and network jitter, and in an Agent loop, that latency compounds with every turn.
The transport protocol is another variable. Traditional Responses API calls usually go over HTTP/SSE, which means every turn has to establish a new request and carry the context again. WebSocket mode keeps a persistent connection and uses previous_response_id plus incremental input to cut down on redundant transmission and processing. OpenAI’s official numbers are as follows:
- A round of API optimizations in late 2025 improved first-token latency by nearly 45%.
- In a specific workflow with more than 20 tool calls, WebSocket mode delivered up to roughly 40% end-to-end speedup.
- Vercel-related integrations reported up to about 40% latency improvement, Cline’s multi-file workflow reported around 39% speedup, and OpenAI models in Cursor reported up to about 30% improvement.
These figures come from different products and test scenarios, and they represent upper-bound values for specific workflows. Some compatible gateways only implement HTTP/SSE, or don’t fully support the WebSocket and incremental state management that Codex uses—integrations like that won’t get this part of the benefit.
2.3 Codex’s Context Caching and Tool Invocation Counts
In long-running tasks, historical messages, tool definitions, and repeated context can consume a large number of input tokens. When prompt caching hits, the processing time for that prefix can be reduced. OpenAI documentation indicates that GPT-5.6 and later series support new cache write, read, and TTL controls.
The catch is that caching depends on the stability of the request prefix. If the proxy layer rewrites the request prefix, changes the order of tool definitions, or shifts the cache boundary, it can affect cache reuse and force large chunks of context to be reprocessed on every turn. The number of tool calls directly determines the number of request rounds: the more rounds there are, the more each single-round overhead gets multiplied.
2.4 Why Is Codex’s First Response Fine but Subsequent Responses Still Slow?
This is the most common form of the question in the title. TTFT only measures how fast the first token arrives, while the total time for a Codex task is the sum of all rounds. Total time can be expressed as:
T_total = Σ(API request processing time + model inference time + network transfer time + local tool execution time + waiting and retry time)
A normal first response but slow overall performance usually comes from a few situations: low sustained output speed (TPS) makes long replies slow down every round; after a tool finishes executing, the model runs inference again, and each re-inference has to process the context once more; the streaming connection drops or times out midway, the client triggers a retry, and what the user sees is “the model has stopped.” By a rough mechanism calculation, a task that requires 20 serial model invocations, with an extra 3 seconds each time, will take about 60 seconds longer in total. This number is meant to illustrate the cumulative effect, not an actual measured result.
What evidence do the public cases provide for Codex’s slowness issue?
The two cases below come from user reports in the openai/codex repository. They’re individual logs from single users, meant to illustrate the mechanism, and don’t represent the industry norm.
3.1 Issue #60831: Roughly a sevenfold swing in response time within the same session
In Issue #60831, filed in November 2026, the reporter observed two requests in the same session, from the same client process, and with identical reasoning settings: both compressed request bodies were about 13.09 MB, no context compaction occurred in between, and the image history was unchanged. The slow one took 109.317 seconds from completion of request compression to receipt of HTTP response headers, while the fast one took 15.637 seconds—a ratio of about 6.99x.
The timing basis is worth noting: these two numbers measure time “until response headers are received,” which falls in the service processing stage rather than the total task completion time; both requests also came from the same path, so this isn’t a comparison between subscription and third-party access. What it shows is that even when context size stays constant, server-side processing time itself can fluctuate significantly. The report alone can’t determine which specific service component caused the bottleneck.
3.2 Issue #44305: Tool loops make a read-only task’s runtime balloon
In Issue #44305 from September 2026, the reporter compared similar read-only tasks: another agent completed the task in about 10.6 seconds using three parallel reads; Codex timed out after running for 91.5 seconds and still hadn’t produced a complete answer. During that time, Codex performed about 11 model inference steps and 11 tool calls, with cumulative input of about 295,042 tokens, including about 260,608 cached input tokens.
Based on these numbers, cached input accounted for about 88.3%, indicating a good cache hit rate, but the serial 11-round loop still made the runtime far longer than the parallel-read approach. The two agents’ working strategies differed to begin with, so the time difference can’t be attributed entirely to Codex or the model, but it clearly illustrates how invocation rounds and serial execution amplify total runtime.
On top of that, two other categories of problems are directly tied to third-party integration: Issue #33029 reports that when Codex Desktop uses a third-party compatible interface, the model endpoint works fine, but the desktop app still requests some ChatGPT auxiliary services, and timeouts on those requests slow down app responsiveness; Issues #41340 and #42471 report, respectively, that a third-party Responses endpoint showed “stream disconnected before completion,” and that tool-call events were received but never entered the execution flow. Getting simple chat working and getting a complete Codex tool loop working are two different levels of compatibility requirements.
4 How Do You Find Where Codex Is Slow?
4.1 Pinpoint Codex Bottlenecks with Four Core Metrics
| Metric | How to record it | What it reveals |
|---|---|---|
| TTFT | Wait time for the first meaningful output of each request | Queueing, model startup, network first packet |
| End-to-end latency | Total time from task submission to completion | Overall experience, and the final basis for judgment |
| Model / tool invocation count | Count reasoning rounds, tool calls, and tool execution time | Agent strategy and serial amplification |
| Cache hits | Total input, cache reads, cache writes, output tokens | Cost of reprocessing context |
Beyond these four, it’s worth also recording TPS, the input and output tokens per request, the protocol used (WebSocket or SSE), and the counts of 429s, 5xx errors, timeouts, and retries. These supporting data help you distinguish “slow” from “slow because of retries after an error.”
4.2 Steps for Running the Three-Way Codex Comparison Test
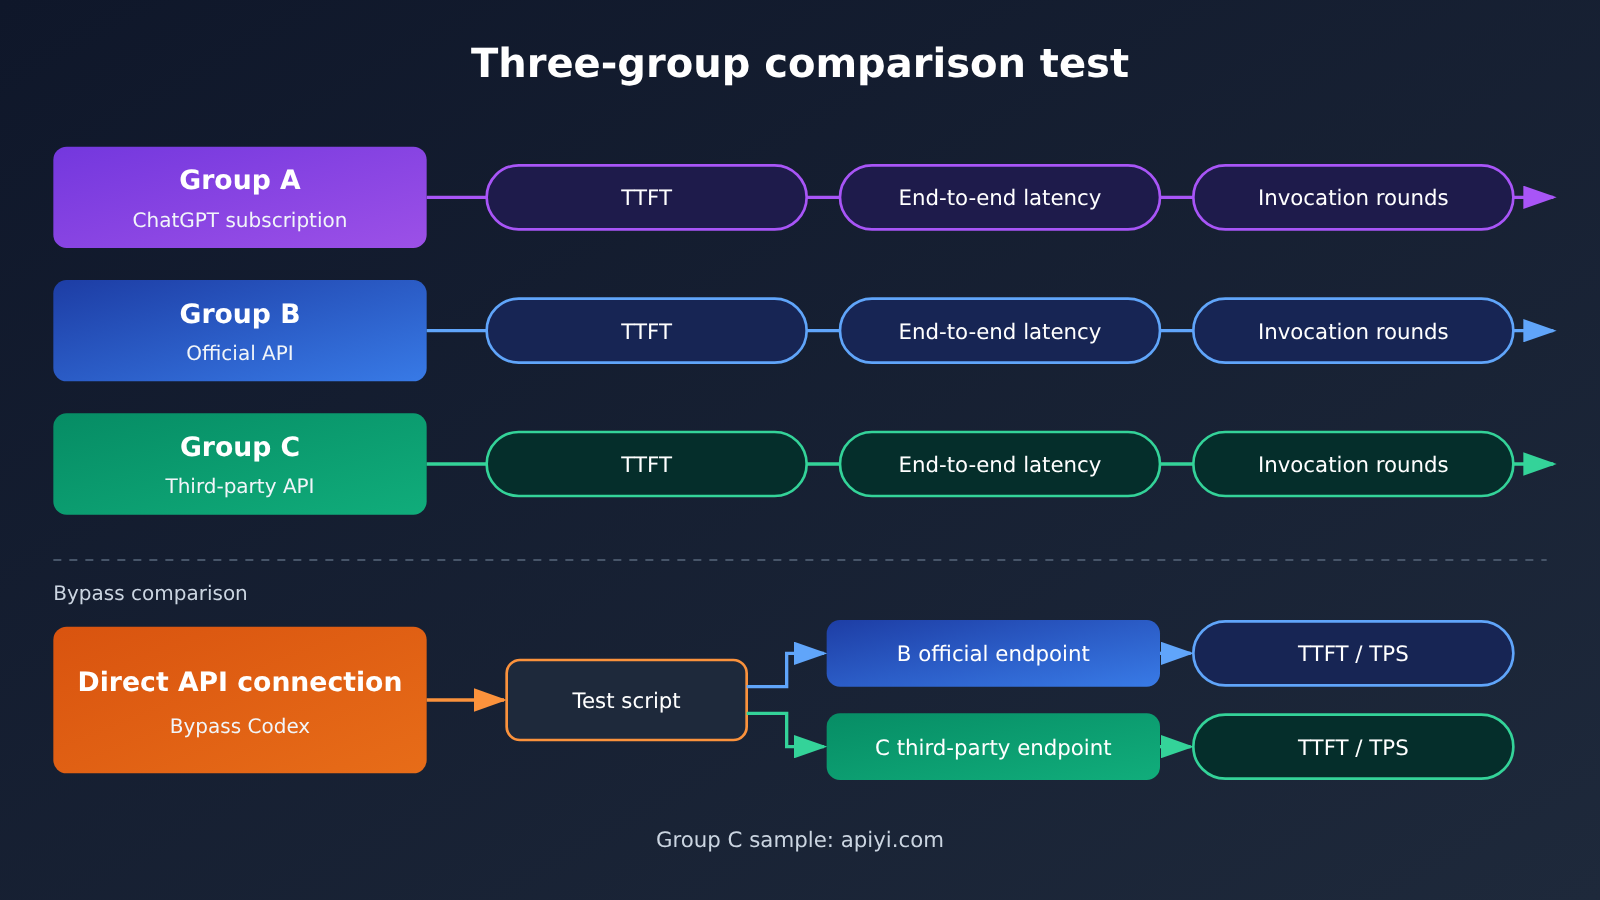
A controlled comparison starts with controlled variables: keep the model ID, reasoning effort, Codex version, project files, and task description identical, and run each setup once in a fresh session and once in a long session so you can spot the effect of context length.
- Group A: Sign in to Codex with a ChatGPT subscription, run the standard task, and record end-to-end latency and the number of turns.
- Group B: Connect Codex using the official API key for the same model, and run the same task.
- Group C: Connect Codex through a third-party compatible API, and run the same task.
- Direct-connection group: For both the B and C paths, bypass Codex and send the same single request from a script to measure TTFT and TPS.
The gap between A and B mainly reflects service differences between the subscription path and the API path; the gap between B and C reflects differences in gateway, routing, and inference service; and the gap between the direct results and the results inside Codex reflects the extra overhead introduced by the agent loop, protocol compatibility, and the client. For each group, run the test several times and take the median — that way you won’t mistake a one-off blip for a conclusion.
The script below is for the “direct-connection” test: it measures TTFT, total duration, output tokens, and TPS through a streaming Responses request.
import time
from openai import OpenAI

client = OpenAI(
    api_key="YOUR_API_KEY",
    base_url="https://api.apiyi.com/v1"  # APIYI unified endpoint; switch to the official URL to run the Group B comparison
)

start = time.perf_counter()
ttft = None
stream = client.responses.create(
    model="YOUR_MODEL_ID",            # keep this consistent with the model ID used in Codex
    reasoning={"effort": "medium"},   # keep this consistent with the reasoning effort used in Codex
    input="阅读下面的函数并指出潜在 bug:def add(a, b): return a - b",
    stream=True,
)
usage = None
for event in stream:
    if event.type == "response.output_text.delta" and ttft is None:
        ttft = time.perf_counter() - start
    elif event.type == "response.completed":
        usage = event.response.usage

total = time.perf_counter() - start
out_tokens = usage.output_tokens if usage else 0
print(f"TTFT: {ttft:.2f}s | 总耗时: {total:.2f}s | 输出: {out_tokens} tokens")
if ttft and total > ttft:
    print(f"TPS: {out_tokens / (total - ttft):.1f} tokens/s")
View the full script for repeated multi-round tests and cache statistics
import time
import statistics
from openai import OpenAI

ENDPOINTS = {
    "official": {"base_url": "https://api.openai.com/v1", "key": "OFFICIAL_KEY"},
    "apiyi": {"base_url": "https://api.apiyi.com/v1", "key": "APIYI_KEY"},  # APIYI endpoint
}
MODEL = "YOUR_MODEL_ID"
EFFORT = "medium"
# Use a long fixed prefix to mimic Codex's system prompt and tool definitions, so cache hits are easier to observe
PREFIX = "你是代码审查助手。项目规范如下:\n" + ("- 函数必须有类型注解。\n" * 300)
TASK = "检查这个函数:def add(a, b): return a - b"


def run_once(client):
    start = time.perf_counter()
    ttft, usage = None, None
    stream = client.responses.create(
        model=MODEL,
        reasoning={"effort": EFFORT},
        input=PREFIX + TASK,
        stream=True,
    )
    for event in stream:
        if event.type == "response.output_text.delta" and ttft is None:
            ttft = time.perf_counter() - start
        elif event.type == "response.completed":
            usage = event.response.usage
    total = time.perf_counter() - start
    cached = 0
    if usage and getattr(usage, "input_tokens_details", None):
        cached = usage.input_tokens_details.cached_tokens or 0
    return {
        "ttft": ttft or total,
        "total": total,
        "input": usage.input_tokens if usage else 0,
        "cached": cached,
        "output": usage.output_tokens if usage else 0,
    }


def bench(name, cfg, rounds=5):
    client = OpenAI(api_key=cfg["key"], base_url=cfg["base_url"])
    results, errors = [], 0
    for _ in range(rounds):
        try:
            results.append(run_once(client))
        except Exception as e:
            errors += 1
            print(f"[{name}] 请求失败: {e}")
    if not results:
        return
    med = lambda k: statistics.median(r[k] for r in results)
    hit = sum(r["cached"] for r in results) / max(sum(r["input"] for r in results), 1)
    print(
        f"[{name}] TTFT中位数 {med('ttft'):.2f}s | 总耗时中位数 {med('total'):.2f}s | "
        f"缓存命中率 {hit:.1%} | 失败 {errors}/{rounds}"
    )


for name, cfg in ENDPOINTS.items():
    bench(name, cfg)
When running the Group C test inside Codex, you need to configure a third-party endpoint as the model provider. Here’s the usual ~/.codex/config.toml layout — for the exact field names, defer to the official docs for the Codex version you’re using:
model = "YOUR_MODEL_ID"
model_provider = "apiyi"
model_reasoning_effort = "medium"

[model_providers.apiyi]
name = "APIYI"
base_url = "https://api.apiyi.com/v1"
env_key = "APIYI_API_KEY"
wire_api = "responses"
🚀 Quick start: For the Group C comparison, you can apply for a free new-user trial quota at APIYI (apiyi.com), then use the same key to switch between multiple models and run the script above for each one — that gets you comparable TTFT and total latency data fast.
4.3 Codex optimization solutions mapped to symptoms
| Symptom | Check first | What to do |
|---|---|---|
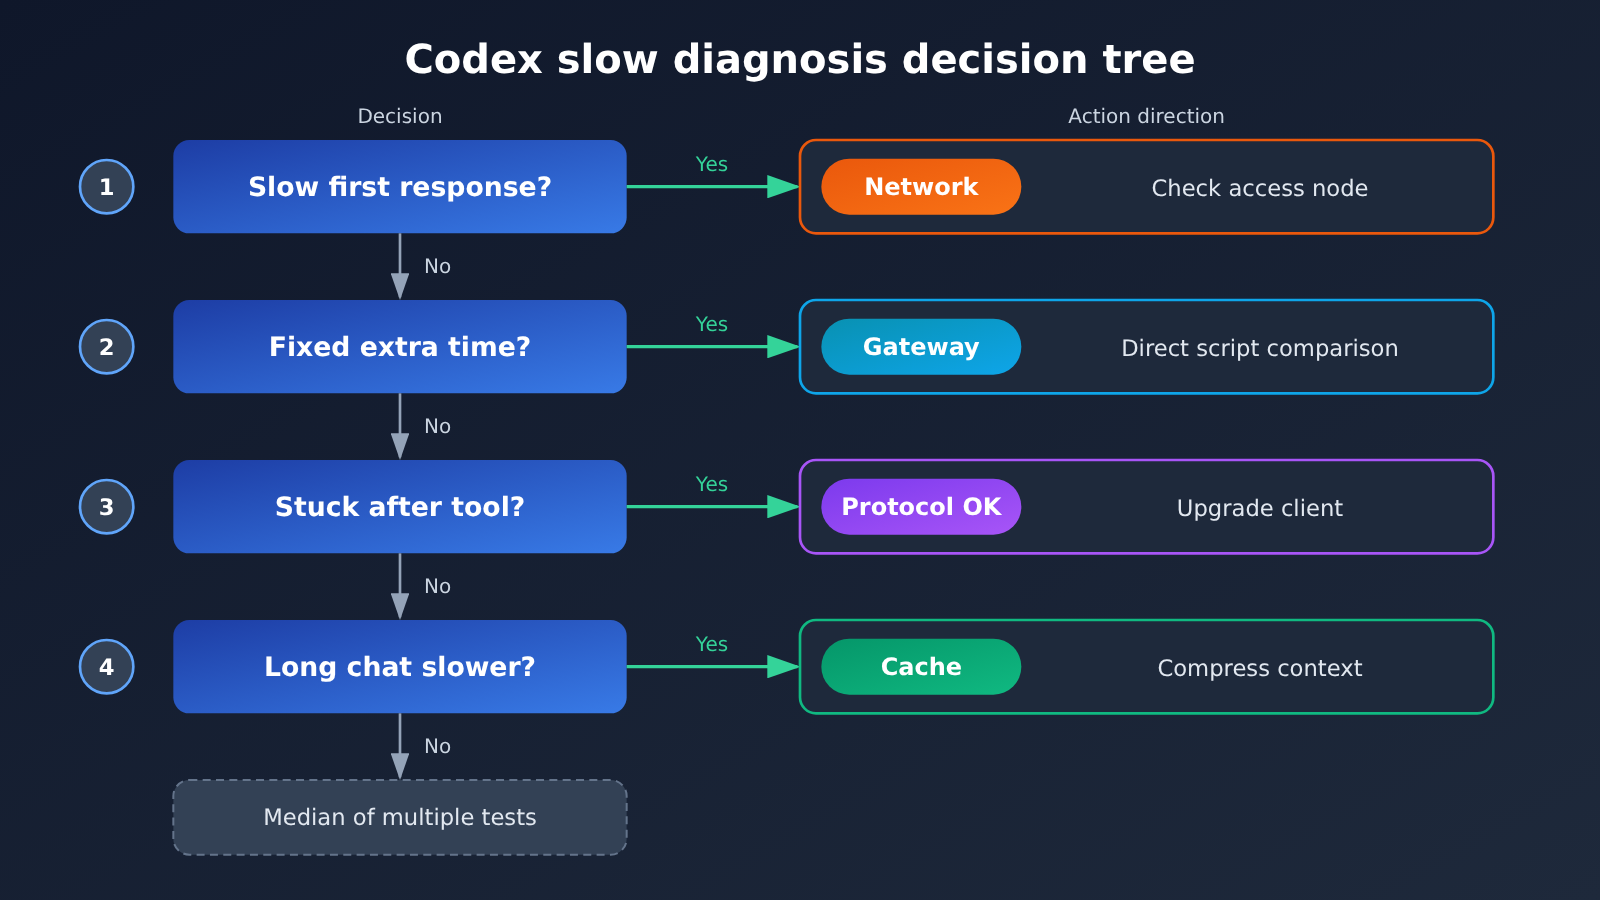
| Slow first response | Queue, model startup, network first packet | Switch to a closer access node, confirm the service tier, and compare outside peak hours |
| Fast first response, slow afterward | TPS, tool rounds, caching | Reduce reasoning effort, limit output length, check cache hit rate |
| Consistent extra time on every call | Proxy chain, extra requests | Use a direct-connect script to compare groups B and C and pinpoint gateway overhead |
| Stuck after tool call | Responses events, tool returns | Check for stream interruptions or lost tool events; upgrade the client version |
| Long conversations noticeably slower than new ones | History tokens, compaction, caching | Start a new session or trigger context compaction when appropriate, and watch for changes in cache reads |
| Speed fluctuates | Service load, retries, network jitter | Count 429/5xx responses and timeouts; run multiple tests and take the median |
| Desktop app sluggish overall, API fine | ChatGPT auxiliary service requests | See Issue #33029, check whether auxiliary requests are timing out, and switch to the CLI if necessary |
Optimization at the model level follows the approach in OpenAI’s latency guide: reduce output tokens, shrink the input context, cut the number of calls, parallelize independent steps, and don’t hand off to the model what a regular program can do. For Codex, the most direct lever is to give the task description a clearer scope so the Agent goes through fewer exploratory read rounds.
5 When Choosing a Third-Party API for Codex, Which Metrics Matter More Than the Unit Price?
5.1 Move from token unit price to task completion cost
In Codex scenarios, the real cost is determined by “getting one task done.” A low-priced endpoint can end up consuming more tokens and time if it has poor cache hit rates, requires many invocation rounds, or constantly streams-fails and retries. When evaluating, put these items together: task success rate, end-to-end latency, total tokens consumed per task (including cache reads), and the extra cost from failures and retries.
| Evaluation Dimension | Key Focus | Test Method | Available Platforms |
|---|---|---|---|
| Model identity and version | Whether the model ID and version are explicit, stable, and available | Check the returned model field against the docs | APIYI apiyi.com, official API |
| First token and sustained speed | Median and variance of TTFT and TPS | Multi-round testing with a direct-connection script | APIYI apiyi.com, official API |
| Multi-turn agent completion time | Total elapsed time for real tasks inside Codex | Three-group controlled test | APIYI apiyi.com, official API |
| Protocol compatibility | Support for Responses, WebSocket, and tool events | Run one full read-file + edit-code + test task | Depends on the provider’s docs |
| Cache support | Whether cache-read tokens are returned correctly | Tally the cache fields in usage | Depends on the provider’s docs |
| Stability and billing | Failure rate, concurrency, billing transparency | Log 429/5xx responses and billing details | Depends on the provider’s docs |
5.2 Evaluate APIYI and other third-party endpoints with real tasks
APIYI apiyi.com is an AI Large Language Model API aggregation platform: one API key lets you call mainstream models such as OpenAI, Claude, and Gemini, with an interface compatible with the OpenAI protocol and billed by usage. Its value in the Codex context lies mainly in making side-by-side comparisons easy — switch between different models and tiers using the same configuration, and you can generate comparable data on your own projects.
Different third-party providers vary in their pipelines, protocol support, and stability, so evaluations should be grounded in concrete test data and the service agreement. Pick 2–3 representative tasks (for example, a multi-file refactor and a bug fix with tests), run them separately on each integration method following the approach in Section 4, then decide based on success rate and total tokens.
💡 Selection tip: First use a direct-connection script to filter out options whose TTFT and TPS are clearly off, then put the remaining candidates into Codex to run full tasks. With APIYI apiyi.com’s unified interface, you can compare multiple models without changing your code structure.
FAQ
Q1: Where do the speed differences between the Codex subscription and third-party APIs mainly come from?
They come from the overall differences in the service path: the actual model deployment, reasoning effort, service tier, gateway link, transport protocol, cache hits, and the degree of tool-event compatibility. Codex’s multi-turn Agent loop accumulates these single-round differences round after round, so the total time gap is often much larger than the gap on a single request.
Q2: TTFT looks normal, so why is the Codex task still slow?
TTFT only measures the wait time for the first token. A single Codex task involves multiple rounds of reasoning and tool calls, and sustained output speed, re-reasoning after tool execution, cache misses, and mid-way retries all stretch out the total time. To judge the experience, look at end-to-end elapsed time and the number of invocation rounds.
Q3: How much faster can WebSocket mode make Codex?
OpenAI’s published figure: in specific workflows with more than 20 tool calls, end-to-end speed improves by up to about 40%. That’s an upper bound for a particular scenario; the actual gain depends on the task’s rounds and whether the interface fully supports WebSocket and incremental state management.
Q4: Codex keeps getting slower in long conversations — what should I do?
Start by recording the total input tokens and cache-read tokens for each round, and confirm whether the cache is hitting normally. If the historical context is too long, start a new session or trigger context compaction; at the same time, narrow the task scope and cut down on exploratory file-reading rounds.
Q5: How can I quickly measure how a third-party API really performs in Codex?
1. Sign up at APIYI apiyi.com and get an API key plus free trial quota;
2. Use the direct-connection script in this article to measure TTFT, TPS, and cache hits;
3. Configure Codex as described in Section 4.2, run the same task as on the subscription side, and compare end-to-end elapsed time and invocation rounds.
That way you can see the differences in the inference service and the differences caused by the Agent loop separately.
Q6: Can the data in public Issues represent Codex’s general performance?
Not directly. Issues #60831 and #44305 are both single-user logs; the former measures time to HTTP response headers, while the latter is a timed-out read-only task. Their value is in showing how server-side fluctuations and serial tool loops affect elapsed time — the specific conclusions need to be verified with your own task tests.
Key Takeaways on Codex Speed Differences
- Different pathways: Subscription login and API key access run on different billing and serving paths — the same model name doesn’t mean the same deployment.
- Loops amplify it: Codex’s agent loop compounds small per-turn delays into a noticeable difference in total runtime.
- Layered metrics: TTFT measures the first response; end-to-end latency and turn count are what actually reflect real user experience.
- Protocol matters: WebSocket can deliver up to ~40% speedup in multi-turn tool-calling scenarios, but it requires full support on the endpoint side.
- Verify your cache: A proxy layer that changes request prefixes can break caching, so track cache-read tokens.
- Run controlled tests: Compare subscription, official API, and third-party API on the same task as three groups, plus a direct-connection test to isolate the bottleneck.
- Choose by task: Test horizontally on platforms like APIYI (apiyi.com) using real tasks, and look at cost-per-completed-task rather than sticker price per token.
Summary
Two speeds from the same Codex comes down to the combined effect of serving paths and the agent loop:
- At the mechanism level: Model, reasoning effort, service tier, gateway, protocol, caching, and the tool loop all contribute to total latency — and any single-turn difference gets amplified across multiple turns.
- At the evidence level: Official data shows that protocol and tier optimizations can deliver meaningful speedups, while user logs show that server-side fluctuations and serial loops can significantly stretch out task duration.
- At the methodology level: Record the four core metrics, run three comparison groups plus a direct-connection test, then optimize symptom by symptom.
When troubleshooting, lock down the model and reasoning effort first, then let the data speak. If you need to compare across multiple models and access methods, you can use APIYI’s unified interface to keep testing costs to a minimum.
📚 References
- Codex as a platform: build on the open agent harness: OpenAI explains what the Codex Agent Harness is responsible for
- Link:
developers.openai.com/blog/codex-as-a-platform -
Notes: The official basis for understanding Codex’s multi-turn model invocation and tool loop
-
Codex authentication docs: ChatGPT login and API key as the two access paths
- Link:
learn.chatgpt.com/docs/auth?surface=cli -
Notes: How subscription entitlements differ from API billing, plus the rate-limiting rules
-
Speeding up agentic workflows with WebSockets in the Responses API: An OpenAI engineering post
- Link:
openai.com/index/speeding-up-agentic-workflows-with-websockets -
Notes: The agent loop flow and the WebSocket speedup numbers
-
WebSocket mode docs: WebSocket mode in the Responses API
- Link:
developers.openai.com/api/docs/guides/websocket-mode -
Notes: Persistent connections, incremental input, and when this mode fits
-
Latency optimization guide: OpenAI’s principles for latency optimization
- Link:
developers.openai.com/api/docs/guides/latency-optimization -
Notes: Ideas like output tokens, number of calls, and parallelization
-
Fast mode docs: Service tiers and how far the acceleration extends
- Link:
developers.openai.com/api/docs/guides/fast-mode -
Notes: The service-tier variable you need to hold constant when comparing speed
-
Prompt caching docs: Cache writes, reads, and TTL
- Link:
developers.openai.com/api/docs/guides/prompt-caching -
Notes: Measuring and optimizing cache hits in long conversations
-
openai/codex Issue #60831 / #44305 / #33029 / #41340 / #42471: User-reported latency and compatibility issues
- Link:
github.com/openai/codex/issues/60831,github.com/openai/codex/issues/44305,github.com/openai/codex/issues/33029 - Notes: Case-by-case logs covering server-side fluctuations, tool-loop amplification, desktop-side helper requests, and third-party protocol compatibility
Author: APIYI Technical Team
Technical discussion: You’re welcome to reach us through the APIYI apiyi.com homepage to talk about Codex integration and performance testing experience. For more resources, visit the docs.apiyi.com documentation center.


