

Author’s note: An AI-generated code rate above 30% doesn’t necessarily mean faster delivery. This article breaks down the reasoning behind the “7% theoretical ceiling,” examines five process bottlenecks, and provides a team self-assessment checklist.
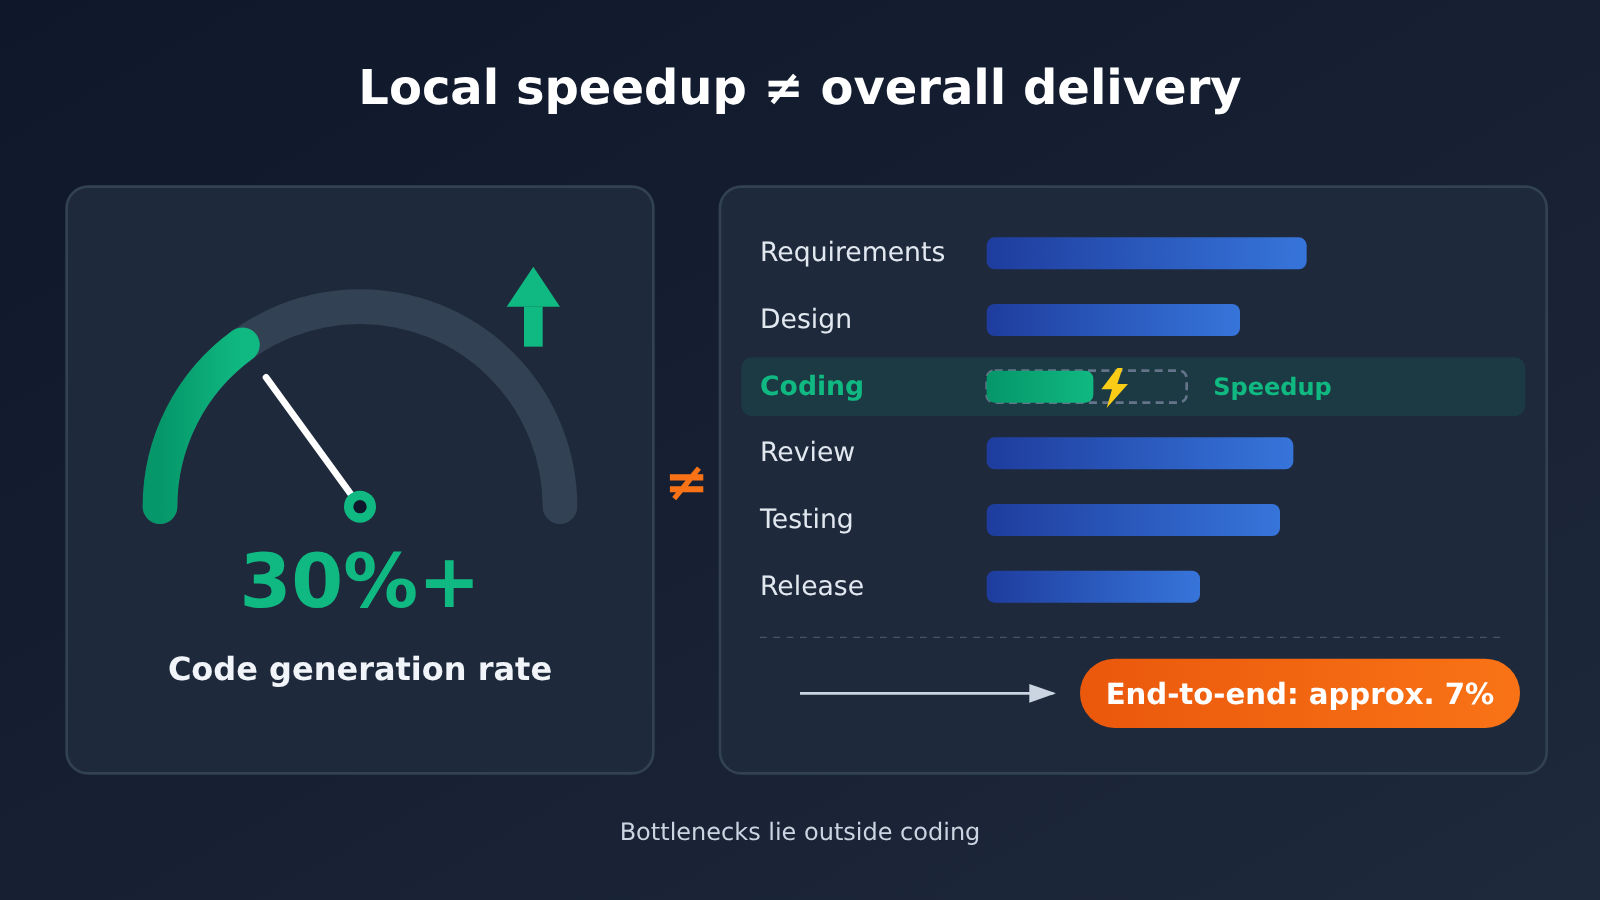
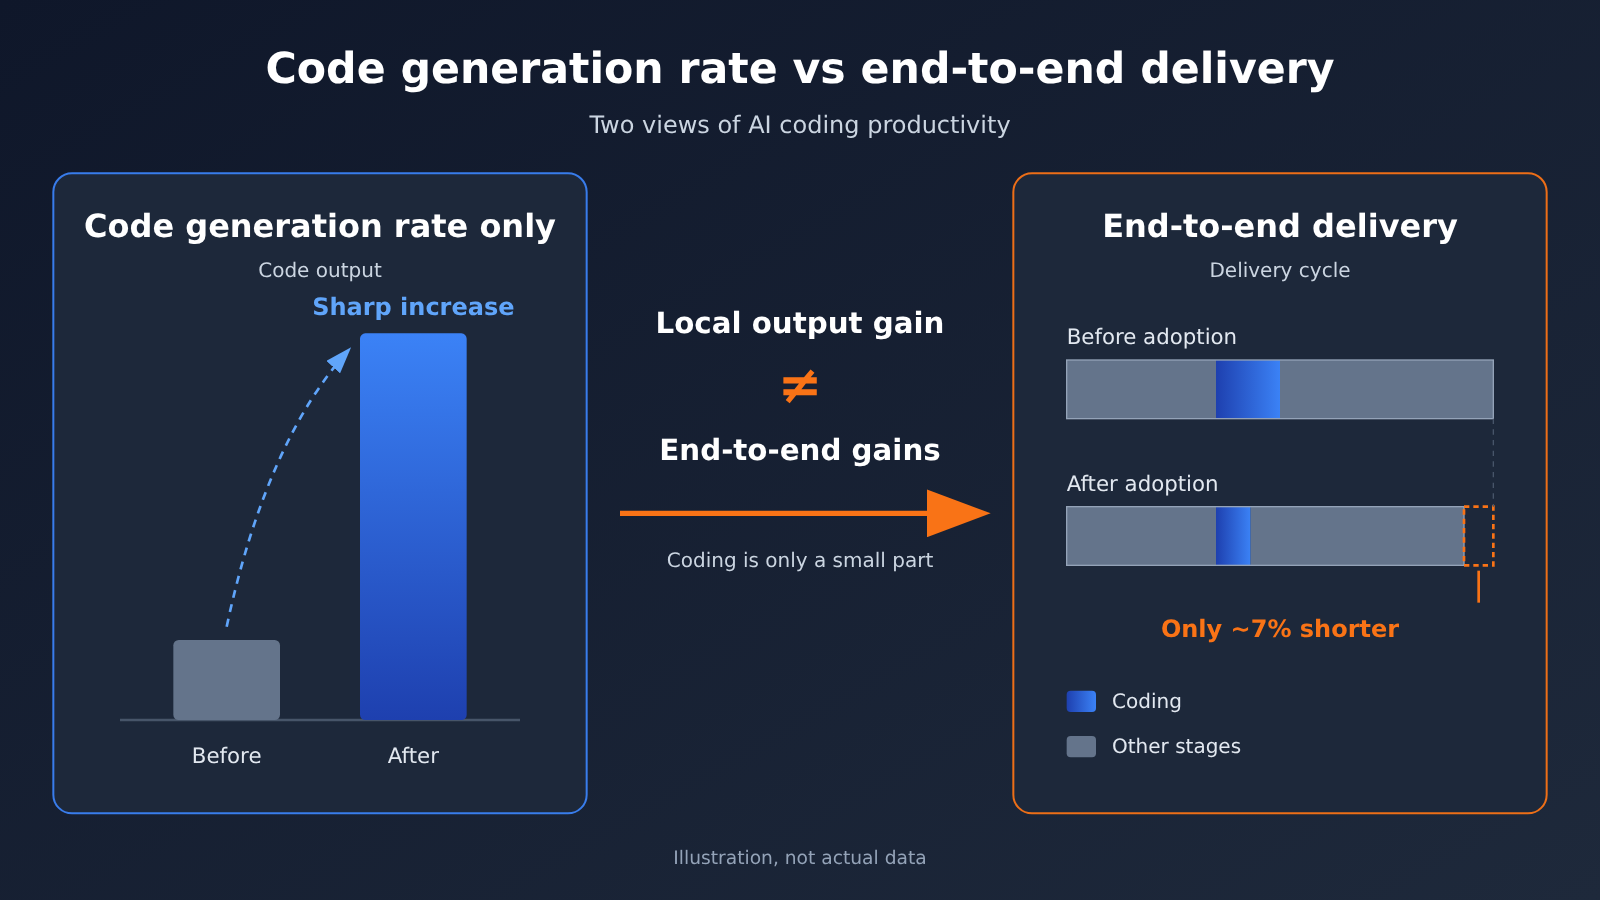
Here’s the bottom line: the AI-generated code rate isn’t the same as delivery speed. When the share of AI-generated code rises from single digits to over 30%, the gain is limited to one stage: coding. End-to-end delivery also includes requirements clarification, design, review, testing, integration, release, and acceptance. Coding often accounts for only part of that chain, so no matter how much the AI-generated code rate rises, the delivery cycle can only shrink by as much as coding’s share of the total allows.
That also explains a frustration many engineering managers face: they’ve rolled out the tools, and the AI-generated code rate looks great on the dashboard, but delivery cycles haven’t changed much. One industry report used a breakdown of a team’s time to estimate an upper limit on end-to-end efficiency gains of around 7%. This isn’t an argument against AI coding. It’s a reminder that five bottlenecks outside coding are what really hold up delivery. We’ll explain how the 7% figure is calculated, where it applies, and how your team can assess its own process.
AI-Generated Code Above 30% vs. a 7% Ceiling: Key Takeaways
Before diving into the reasoning, here’s a quick overview of the key figures and how they’re defined. Pay particular attention to where each number comes from and how reliable it is—the analysis that follows depends on these distinctions.
| Item | Details | Context |
|---|---|---|
| AI-generated code rate | Over 30% | The proportion of code generated by AI; reflects output from the coding stage only |
| End-to-end productivity gain ceiling | Approximately 7% | An estimate based on one team’s breakdown of time spent, not a universal law |
| Industry estimates | Approximately 3%-5% | Based on conversations, without a verifiable sample |
| Effective code throughput | 2-3 times | From a team retrospective; measurement criteria and comparison methods weren’t disclosed |
| Five bottlenecks | Review queues, shift-left testing and observability, Live Demos, role convergence, value reviews | Organizational and process issues |
| Coding Agent integration | Can be unified through aggregation interfaces such as APIYI apiyi.com | Addresses integration and usage visibility, not process bottlenecks |
These figures aren’t contradictory. “2-3 times effective code throughput” refers to coding output, while “7%” and “3%-5%” refer to end-to-end delivery. The first is a local metric; the others are global metrics, with an entire delivery pipeline between them.
Where the 7% Cap Comes From: Code Generation Rate and Coding’s Share of Delivery Time
Breaking Down the End-to-End Improvement Formula
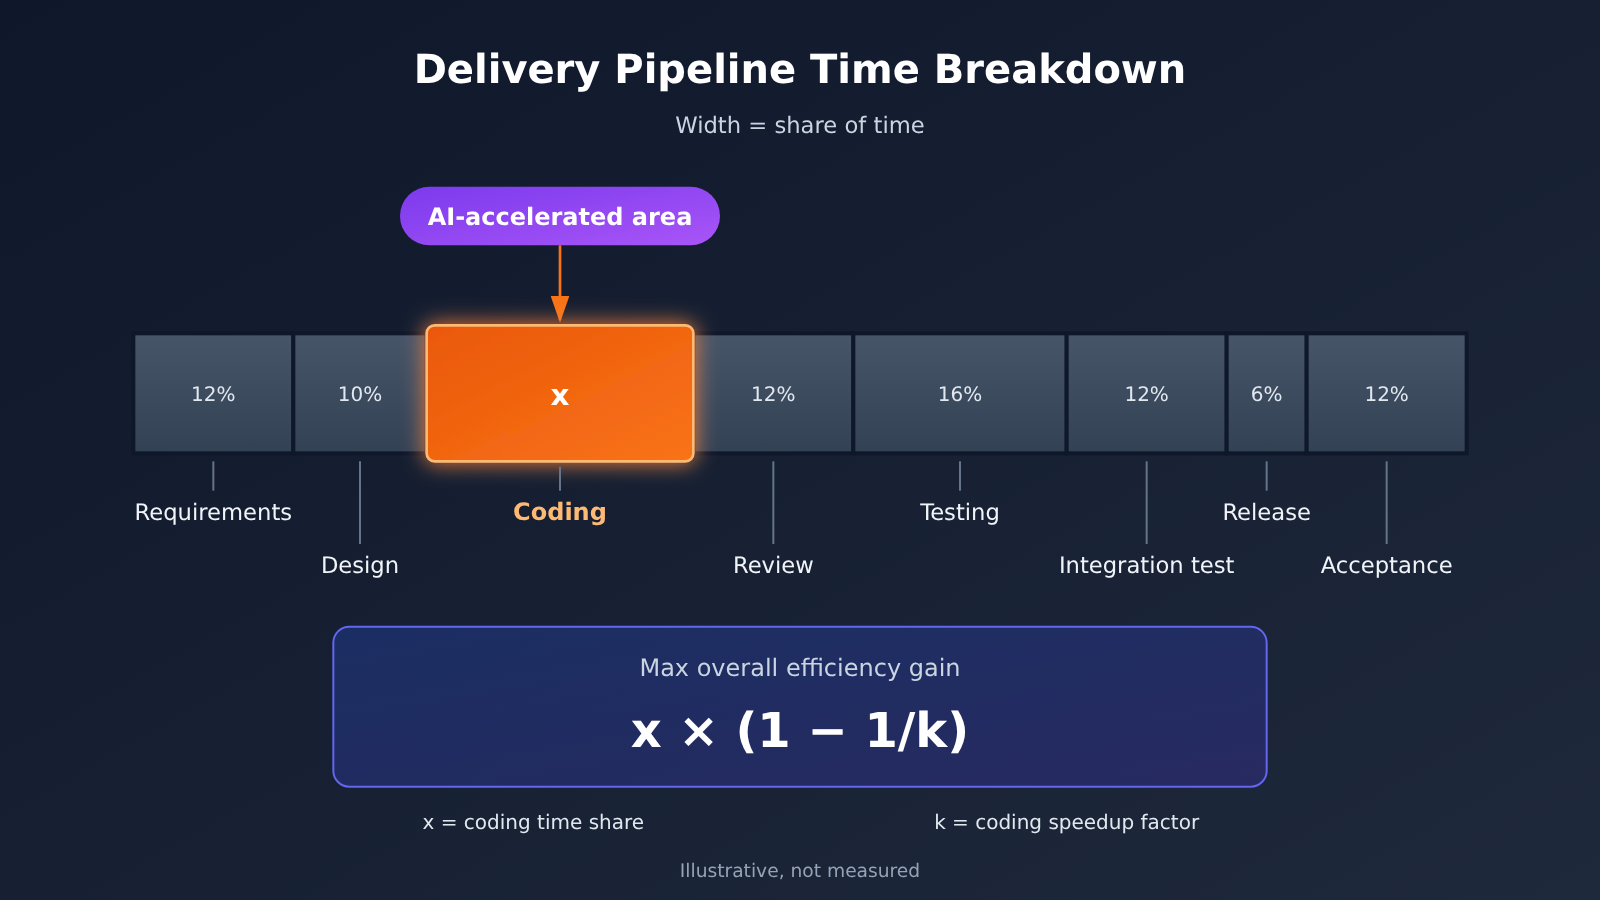
You can estimate the upper limit on end-to-end time savings with a simple formula: maximum end-to-end improvement ≈ x × (1 - 1/k). Here, x is the proportion of total delivery time spent coding, and k is the speedup factor for coding. This is essentially Amdahl’s law applied to software development: if you speed up only one part of a process, its share of the total limits the overall gain.
For example, suppose coding accounts for 14% of delivery time and AI makes it twice as fast (k = 2). The result is 14% × (1 - 1/2) = 7%. Even if coding time were reduced to zero (k approaches infinity), end-to-end delivery time could shrink by no more than 14%. The table below shows results for several hypothetical scenarios. These are illustrations of the formula, not measurements from any team.
Coding’s share x |
Coding speedup factor k |
Maximum end-to-end improvement | Interpretation |
|---|---|---|---|
| 10% | 3 | About 6.7% | Coding is 3 times faster, but the overall gain is still under 7% |
| 14% | 2 | 7% | An example on the same scale as the estimate in the source material |
| 20% | 1.5 | About 6.7% | A smaller speedup quickly dilutes the overall gain |
| 20% | 2 | 10% | Teams that spend a larger share of their time coding have more room for improvement |
| 30% | 2 | 15% | A scenario for coding-intensive teams |
| 20% | Approaches infinity | 20% | The theoretical ceiling if coding time drops to zero |
A 30% Code Generation Rate Doesn’t Mean Coding Is 30% Faster
There’s another commonly overlooked distinction: the code generation rate and k aren’t the same thing. The code generation rate measures how much code AI writes, while k measures how much faster coding becomes. AI-generated code still needs to be read, debugged, and modified, and generation itself comes with the cost of prompting, waiting, and correcting errors.
Even under the extremely simplified assumption that the 30% of code generated by AI takes no time at all, the coding speedup factor is only 1 / (1 - 0.3) ≈ 1.43. Factor in coding’s share of delivery time, and the end-to-end gain is smaller still. So the roughly 7% figure in the source material isn’t surprising. It suggests that the key isn’t “generating more code,” but addressing the stages outside coding.
It’s worth emphasizing again: 7% is an estimate based on the time breakdown of one particular team. Your team’s coding share, requirements stability, and testing practices may differ, so the result could be higher or lower. Its value is as a framework for thinking, not a conclusion you can apply directly.
5 Bottlenecks Keeping Delivery Slow: The Real Problems Beyond Code Generation Rates
When coding gets faster, pressure moves downstream along the delivery pipeline. Some of the five bottlenecks below are new problems amplified by AI coding; others have always been there but were previously masked by the pace of coding.
Bottleneck 1: Review Queues for Key Engineers
The more code AI generates, the more code needs review. Reviews often fall to a handful of key engineers, who need to understand the business context and assess the edge cases and potential risks in AI-generated code. As a result, much of the time saved during coding turns into time spent waiting in the review queue.
What makes this trickier is that AI-generated code can “look right,” so reviewers need to read it more carefully. The review cost per unit of code may not actually decrease. Without changes to the review process—such as tiered reviews, clear rules about which changes non-core engineers can approve, and automated standards checks—key engineers can become the narrowest bottleneck in the entire pipeline.
Bottleneck 2: Shifting Testing and Observability Left
Many teams don’t bring testing, monitoring, and observability into the process until late in development. When coding speeds up, problems pile up faster at the testing stage, concentrating rework at the end. If test cases, instrumentation, and alert rules aren’t designed before or alongside coding, late-stage integration and fixes can wipe out the earlier gains.
Shifting testing and observability left means making validation happen alongside coding. This is especially important for AI-generated code: you need runnable checks to quickly determine whether the output is correct, rather than relying on someone to inspect it line by line.
Bottleneck 3: Use Live Demos to Confirm Requirements and Reduce Rework
The most expensive part of delivery often isn’t writing code—it’s writing the wrong thing and then fixing it. Misunderstood requirements can send a team back through coding, review, and testing all over again. Now that AI makes coding cheaper, a better approach is to quickly build a runnable Live Demo and let stakeholders interact with it to confirm, “Is this what you meant?”
This shifts requirements confirmation from reviewing documents to reviewing prototypes. People can interpret documents differently, while a runnable demo exposes those differences early. The real payoff of lower coding costs may not be finishing production code faster, but making experimentation cheaper.
Bottleneck 4: Role Convergence and the Changing Roles of PDFE and ABE
In a traditional workflow, work passes through numerous handoffs between product, design, frontend, backend, and testing. Each handoff means waiting, lost context, and time spent getting back in sync. The role convergence described in the source material, including roles like PDFE and ABE, is essentially about having one person or a small team cover more of the workflow and reduce the number of handoffs.
As AI takes on more coding work, engineers have more capacity to extend their work into requirements and testing, making role convergence feasible. But it’s worth noting that there’s currently a lack of evidence about the conditions and costs of replicating this organizational change across teams of different sizes. Small teams may be a natural fit, while larger organizations face systemic changes to responsibilities, performance evaluation, and collaboration. They can’t simply copy the approach.
Bottleneck 5: Value Reviews and the Concept Dictionary/SDD
If concepts and data definitions aren’t aligned, the faster AI writes, the faster it gets things wrong. The same business term may mean different things across modules, and interface fields may use inconsistent definitions. These problems tend to surface all at once during integration and acceptance testing. The approach described in the source material is to conduct a value review first, then use a concept dictionary and SDD (spec-driven development) to align concepts and data before writing code.
The value review answers, “Is this worth doing?” The concept dictionary and SDD answer, “Are we talking about the same thing?” These steps may appear to add upfront costs, but they give AI clear, consistent context, making the generated code more likely to align with requirements on the first pass.
5 Bottlenecks and What to Do About Them
| Bottleneck | Typical Symptoms | Recommended Action | Metric to Watch |
|---|---|---|---|
| Review queues for key team members | PR wait times grow, and key reviewers are overloaded | Use tiered reviews and automate standards checks | Average PR wait time |
| Testing and observability come too late | Rework piles up during testing | Design test cases and instrumentation earlier | Number of defects sent back for rework during testing |
| Requirements confirmed through Live Demos | Acceptance reveals that “this isn’t what we wanted” | Use a working prototype to confirm requirements | Number of requirement changes and rework cycles |
| Role consolidation | Too many handoffs and waits, with context lost along the way | Reduce handoffs and let individuals own more of the workflow | Number of handoffs between stages |
| Value reviews and concept dictionaries/SDD | Teams use inconsistent definitions during integration | Align on concepts and data before coding | Number of issues during integration |
Team Self-Check: Breaking Down Delivery Time and the Benefits of Faster Code Generation
Instead of arguing over 7% versus 3%–5%, calculate the numbers for your own team. Here’s a practical method you can use right away—try it on a small project first.
- Break down the stages: Split the journey from request to release into requirements, design, coding, Review, testing, integration, release, and acceptance. Record the actual time spent and wait time for each stage.
- Calculate coding’s share: Divide time spent coding by total delivery time to get your
x. Many teams find this number is smaller than they expected. - Find waiting and rework: Track Review queue time, testing rework, and requirement changes separately. These are often the biggest hidden costs.
- Separate output from value: Treat “code output” and “deliverable value” as different things. Code generation rate and lines committed belong to the former; features released and delivery cycle time belong to the latter.
- Run a small comparison: Compare results before and after on a small project. Don’t rely solely on code generation rate reports.
- Fix the biggest bottleneck first: Prioritize the stage that takes the longest. Don’t introduce every tool and process change at once.
The following is a hypothetical time breakdown template that shows how to fill it in. It doesn’t represent any team’s actual data. Add your own numbers to see how much of the total is spent coding.
| Delivery Stage | Example Share (Hypothetical) | Main Sources of Time Spent | Can AI Coding Directly Speed It Up? |
|---|---|---|---|
| Requirements and value review | 15% | Repeated discussions, aligning on definitions | Indirectly (Live Demo) |
| Design | 10% | Discussing and reviewing solutions | Partially |
| Coding | 15% | Writing and debugging | Directly |
| Review | 15% | Queueing and review | Partially (review assistance) |
| Testing and integration | 25% | Running test cases, rework | Partially (test case generation) |
| Release and acceptance | 20% | Approvals, acceptance feedback | Rarely |
The point of this template is to reveal the structure of your delivery process: if coding accounts for only a small percentage, even doubling your code generation rate will have a limited effect on end-to-end delivery. The real opportunities for improvement lie in Review, testing, and requirements.
Coding Agent Integration and Usage Monitoring: What APIYI Can and Can’t Do
Connecting tools and tracking costs are essential parts of adopting AI coding tools. APIYI apiyi.com supports integration with tools such as Cursor and Cline, providing a unified OpenAI-compatible interface. A single API key gives you access to popular models from OpenAI, Claude, Gemini, and others. To connect, set the tool’s base_url to https://api.apiyi.com/v1.
For engineering productivity teams, usage data is even more valuable. The console’s usage statistics let you track Coding Agent token consumption and see how calls are distributed across models. This helps you decide which tasks warrant a more powerful model and which can be handled by a lightweight one. You can review this data alongside the delivery-time breakdown discussed earlier to assess the relationship between AI coding investment and output.
💡 Integration tip: If your team is evaluating multiple coding models, you can use APIYI apiyi.com to connect them through a unified interface and compare usage. New users receive free testing credits, making it easy to start with a small project. Check the console and documentation for current pricing and model availability.
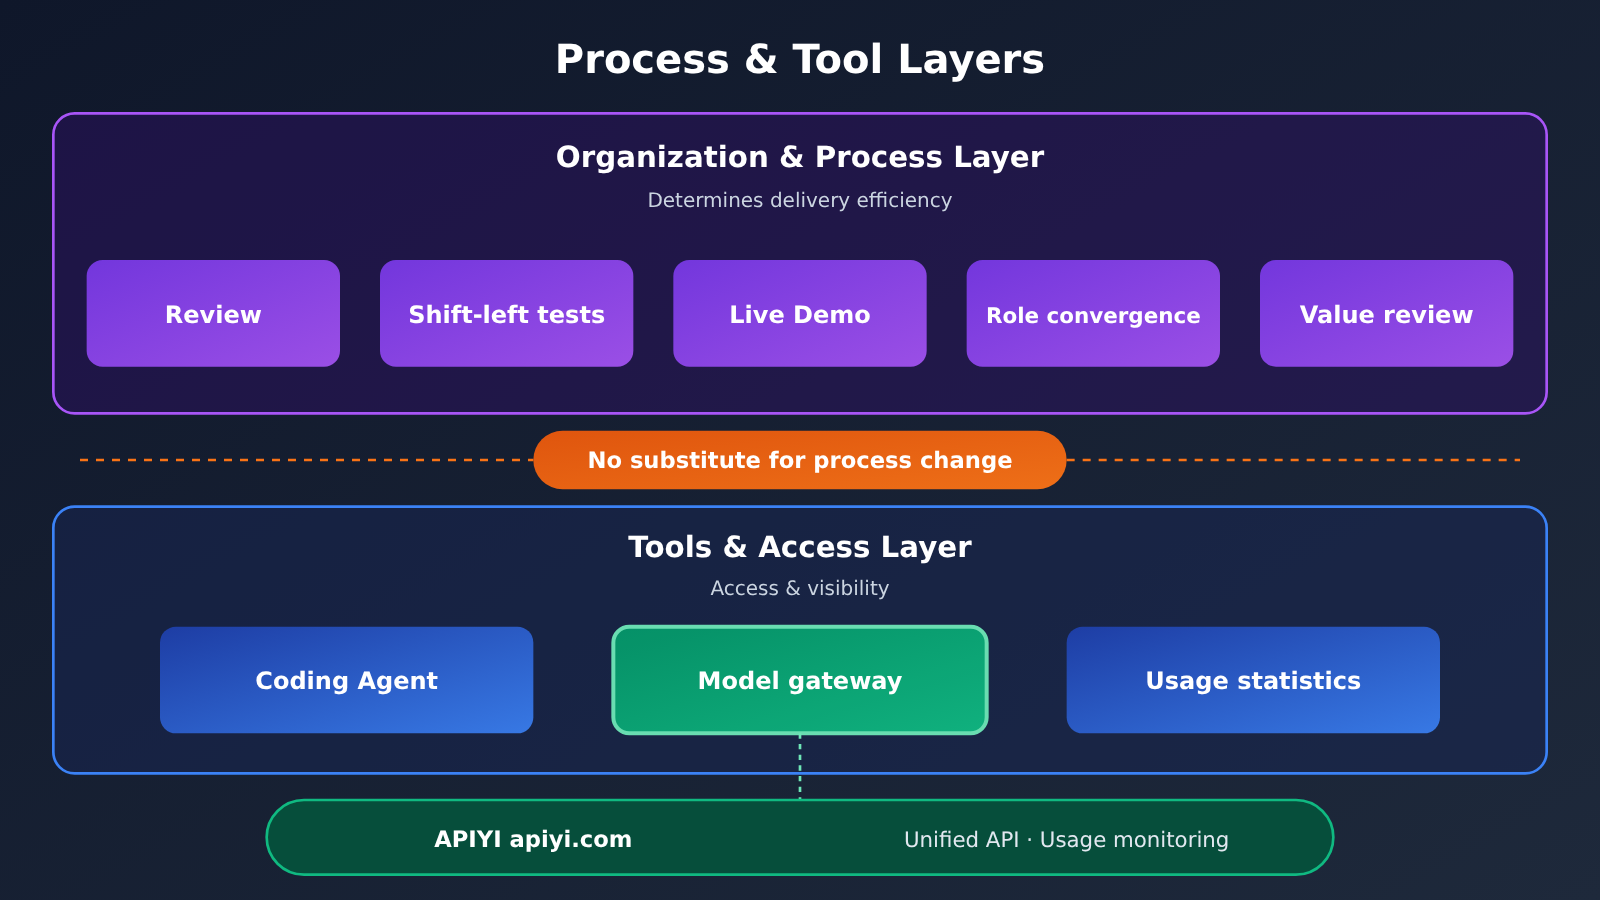
But one point is important: a gateway alone can’t improve end-to-end delivery efficiency. It makes integration and model switching easier and provides visibility into usage. Process bottlenecks such as Review queues, test rework, and mismatched requirements need to be addressed at the organizational level. Treating a gateway as a productivity solution is the same kind of mistake as treating code generation rate as a delivery metric.
Frequently Asked Questions
Q1: If over 30% of the code is AI-generated, why is end-to-end delivery only about 7% faster?
Because AI-generated code only affects the coding stage. The upper limit on end-to-end efficiency gains is approximately `x × (1 – 1/k)`, so if coding accounts for a relatively small share of the total time, the overall gain is capped. Note that 7% is an estimate based on one team’s time breakdown, not a universal result. Your team should recalculate it using its own data.
Q2: Are the 3%-5% and 2-3× figures credible?
Both should be treated with caution. The claim of a 3%-5% end-to-end efficiency gain comes from industry discussions and lacks a verifiable sample. The 2-3× increase in effective code throughput comes from a team retrospective, but its measurement criteria and comparison method weren’t disclosed. They’re useful reference points, but they shouldn’t be the sole basis for a decision.
Q3: Which of the five bottlenecks should we address first?
Start by breaking down how your team spends its delivery time, then prioritize the stage that takes the largest share. Many teams find that review wait times and test rework are the biggest contributors, while others struggle most with changing requirements. Don’t try every improvement at once. Fix the biggest bottleneck first so it’s easier to see the results.
Q4: How can we track model usage and costs for our team’s coding agents?
You can connect your coding tools through a single API endpoint, then check token consumption and model distribution in the console. For example, connecting tools like Cursor and Cline through APIYI at apiyi.com lets you view usage data in one place. Usage tracking helps inform decisions, but process bottlenecks still need to be addressed at the organizational level.
Q5: Is consolidating roles right for every team?
Not necessarily. The idea behind combining roles such as PDFE and ABE is to reduce handoffs, but there’s little evidence about the conditions and costs involved in making similar changes across teams of different sizes. Try a pilot with one small team first, observe changes in handoffs and delivery time, and then decide whether to roll it out more widely.
Code Generation Rate and End-to-End Delivery: Key Takeaways
- Code generation rate isn’t delivery speed: It measures output during coding, not end-to-end productivity.
- The 7% figure comes from a formula:
x × (1 - 1/k). The proportion of time spent coding sets the ceiling on gains. - Keep the figures in context: 7% was calculated for a specific team, 3%–5% came from discussions, and the basis for the 2–3× figure wasn’t disclosed.
- The bottlenecks are outside coding: Review, testing, requirements confirmation, handoffs, and concept alignment take up the bulk of the time.
- Break down time before changing processes: Use a small project for a before-and-after comparison, and fix only the biggest bottleneck at a time.
- Tools handle access and monitoring: APIYI apiyi.com can provide unified access to Coding Agents and track usage, but it won’t solve process problems.
Conclusion: What Teams Should Do After Code Generation Exceeds 30%
A code generation rate above 30% is real progress, but it’s only a starting point. End-to-end delivery depends on the entire workflow, and coding is just one part of it. The formula x × (1 - 1/k) makes the limits of speeding up one part of the workflow clear. The value of the 7% figure isn’t whether it’s precise, but that it reminds us to shift our focus from “how much code we wrote” to “how much value we delivered.”
The real opportunities for improvement lie in Review processes, shifting testing and observability left, confirming requirements with Live Demos, consolidating roles, and aligning on value and core concepts. These are organizational and process changes that no tool can replace. On the tooling side, we recommend using APIYI apiyi.com to access coding models through a single platform and monitor usage, then evaluating usage data alongside delivery time to assess return on investment.
Team Self-Assessment Checklist
- [ ] Have you broken down the total time it takes for a requirement to go from proposal to release?
- [ ] Have you calculated the proportion of total delivery time spent coding,
x? - [ ] Do you track Review queue time and the workload of key team members separately?
- [ ] Are test cases, instrumentation, and alerts designed before or during coding?
- [ ] Do you use runnable Demos, rather than just documents, to confirm requirements?
- [ ] How many handoffs between roles does a requirement go through from proposal to release?
- [ ] Are core concepts and data definitions aligned before coding begins (concept dictionary/SDD)?
- [ ] Do your reporting metrics distinguish between “code output” and “deliverable value”?
- [ ] Have you run a before-and-after comparison on a small project, rather than relying only on code generation rate reports?
- [ ] Are you prioritizing a single biggest bottleneck instead of rolling out every tool at once?
References
- Industry materials on code generation rate and end-to-end delivery: Source for the article’s 7% calculation, five bottlenecks, and figures
- Note: The material was truncated. This article draws only on the visible portion and doesn’t rely on content that wasn’t shown.
- APIYI Documentation Center: Guidance on connecting coding tools and tracking usage
- Link:
docs.apiyi.com - Note: Check the console and documentation for current pricing and model availability.
Author: APIYI Technical Team
Technical discussions: Visit the APIYI apiyi.com homepage to contact us. For more integration resources, see the documentation center at docs.apiyi.com.


